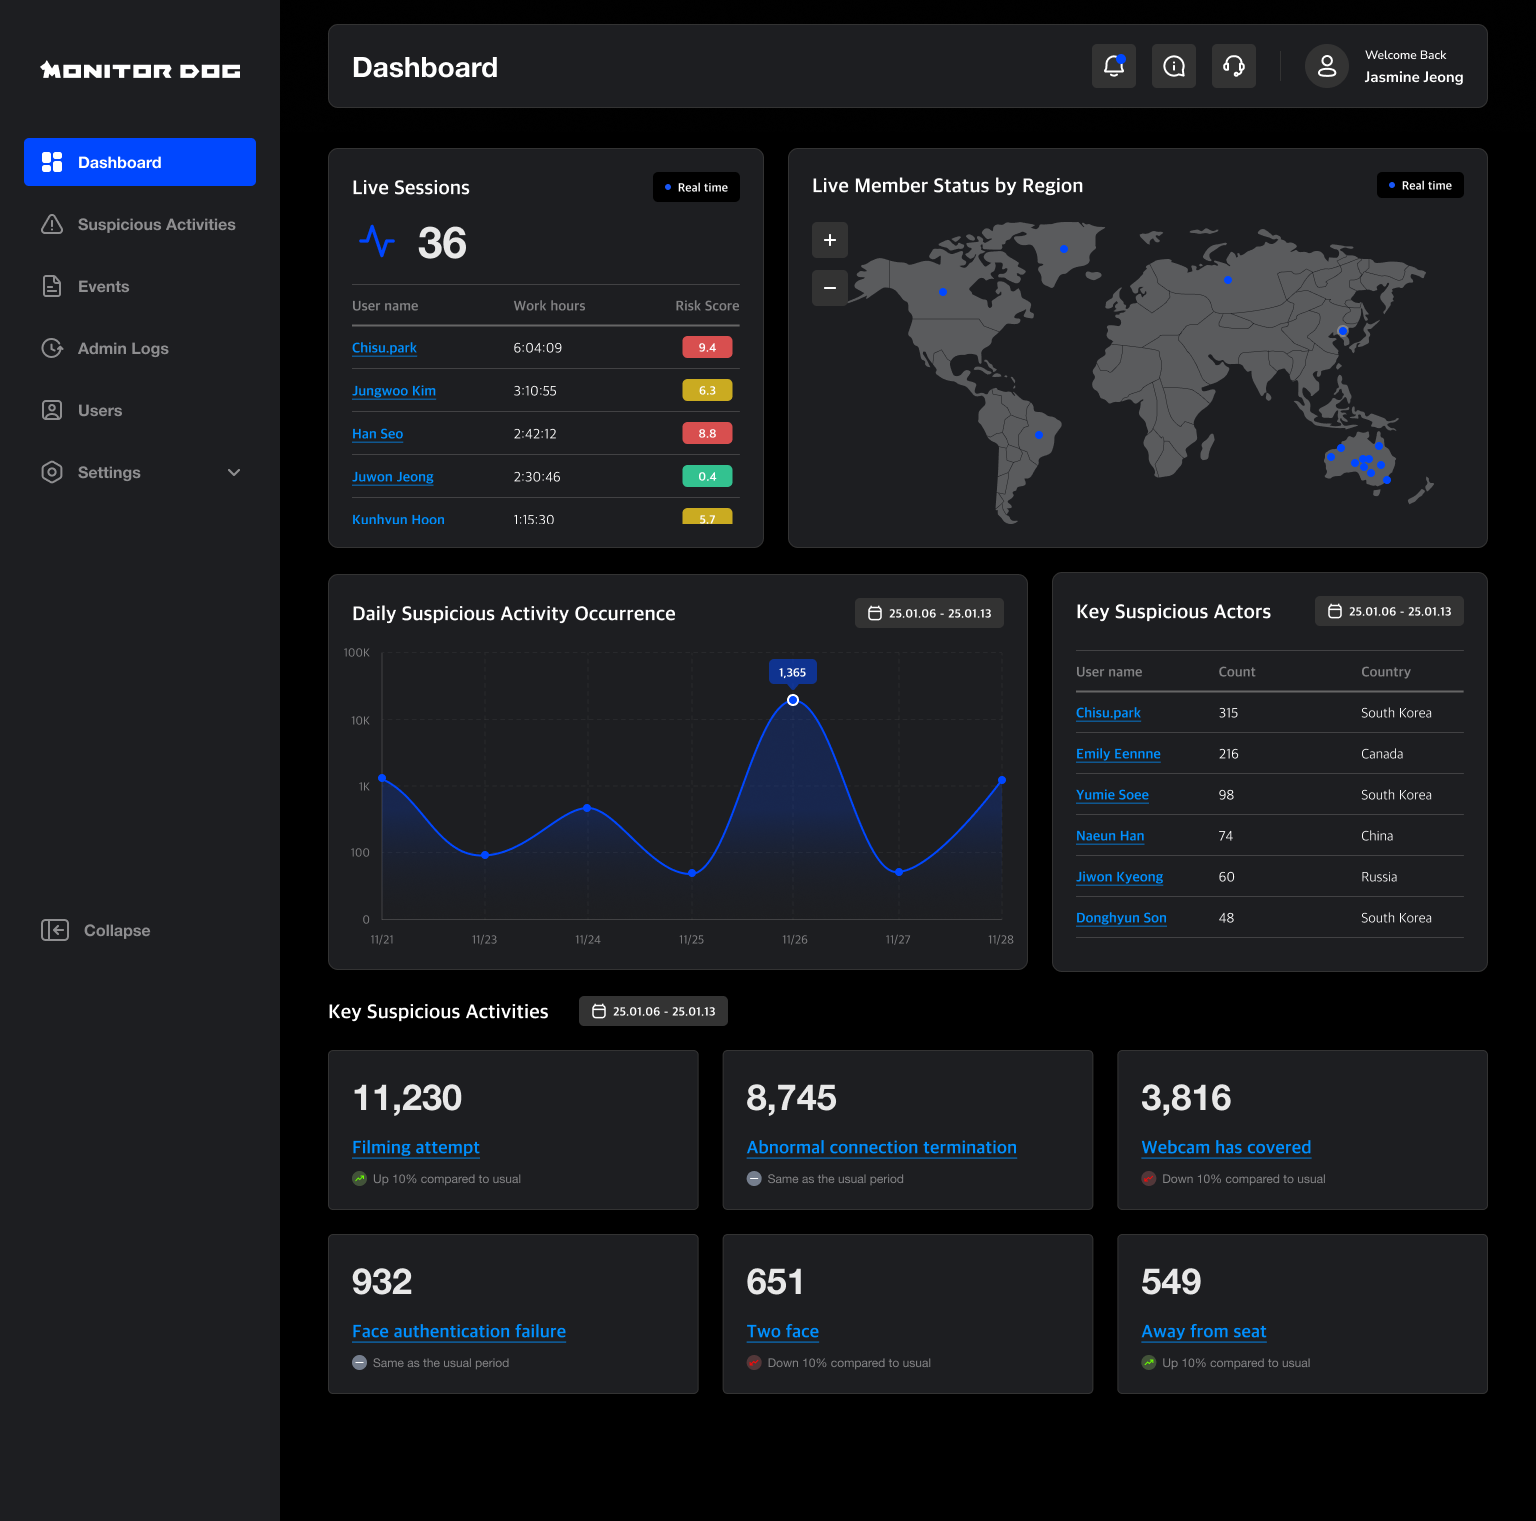
Dashboard
This page describes the layout and key functions of the MonitorDog Admin Dashboard.
The Admin Dashboard provides a centralized view of all major monitoring features across various pages of the MonitorDog Admin Console.
You can check real-time monitoring insights such as:
- User activity overview
- Access distribution by country
- Suspicious behavior statistics
Header
The top header allows you to view system notifications in real time.
If an issue occurs or you have questions, you can directly contact the MonitorDog support team.

Notifications
You’ll receive notifications for events occurring within MonitorDog.
Clicking a notification will take you to the detailed view of that event.
Notifications can be filtered by read/unread status. You can mark all notifications as read, but individual deletion is not supported.
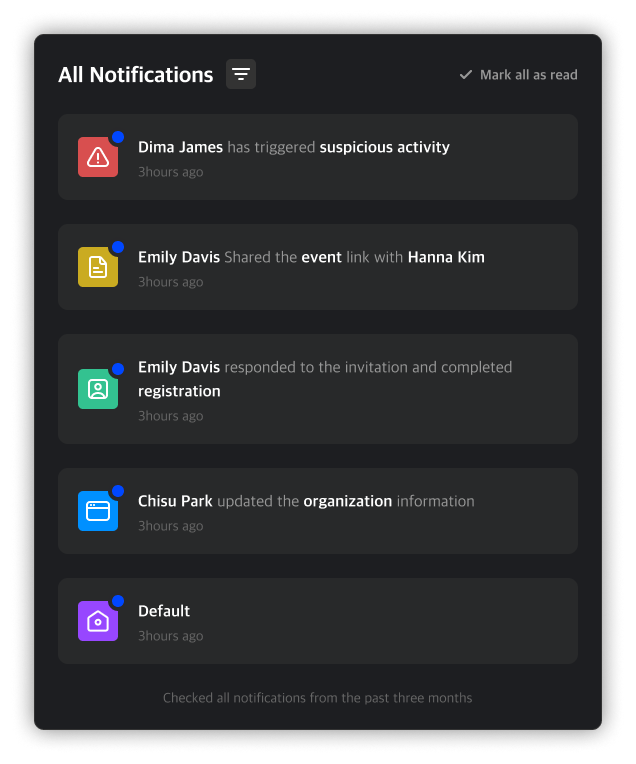
Notification Types
- Event Alert (Red Icon): Notification for events detected from users in your organization. Clicking it opens the event or suspicious activity detail page.
- Shared Alert (Yellow Icon): Notification for events or suspicious activities shared by other admins.
- Signup Alert (Green Icon): Notification shown when a user you invited completes account registration.
- System Alert (Blue Icon): Notices or warnings from the MonitorDog system.
- General Alert (Purple Icon): Standard alerts generated by MonitorDog.
Documentation
Click the i icon to go to the official documentation page.
There you’ll find explanations of commonly used terms and detailed descriptions of each page.
Support
If the documentation doesn't answer your question, you can start a live chat with the MonitorDog support team.
My Info
Click your profile icon to navigate to your personal info page.
Sidebar
Use the sidebar menu to access different pages.
Depending on your role, access to some settings pages may be restricted.
You can click the collapse button at the bottom to minimize the sidebar.
monitordog
┣━━ dashboard
┣━━ suspicious activities
┣━━ events
┣━━ admin logs
┣━━ users
    ┣━━ all members
    ┣━━ admin members
    ┣━━ invitations
┗━━ settings
    ┣━━ detection scenario
    ┣━━ blocked programs
    ┣━━ event lock
    ┣━━ my page
    ┗━━ organization
Q. I was invited as an admin but I can’t access some pages!
A. Page access in the Admin Console depends on your admin permission level.
Detailed Page Access by Admin Role
- Owner: Full access to all pages and settings
- Manager: Full access to all pages and settings
- Editor: Restricted access to "Blocked Programs", "Event Lock" (can edit "Organization" info)
- Viewer: Same restrictions as Editor, but cannot edit "Organization" info
- Limited: Cannot access Monitor Dog Admin Service
Live Session
You can view currently active users and their basic information.
"Active users" refer to users connected via the MonitorDog Agent.
The session time is based on the duration the Agent remains connected.
The Risk Score indicates the risk level of a user’s behavior, ranging from 0 to 9.9.
A high score doesn't impose restrictions on the user, but helps administrators identify potentially suspicious users.
The score increases when events or suspicious activities occur and resets to 0 daily at midnight.
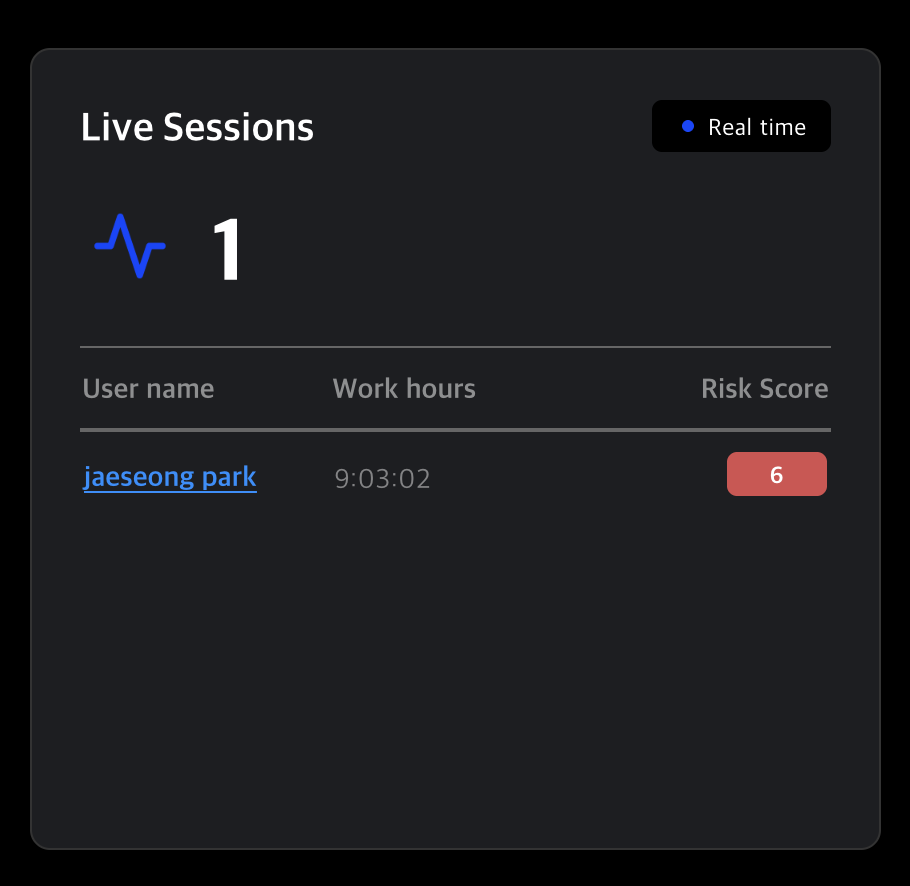
Risk Score Levels and Colors
- Below 3: Green – Low risk
- 3 to 5.9: Yellow – Moderate risk
- 6 and above: Red – High risk
Live Members by Region
You can view currently connected users by country.
Connected countries are highlighted, and hovering over a country shows its name and the number of users.
Use mouse wheel, double-click, or the zoom button to scale the map, and drag to reposition it.
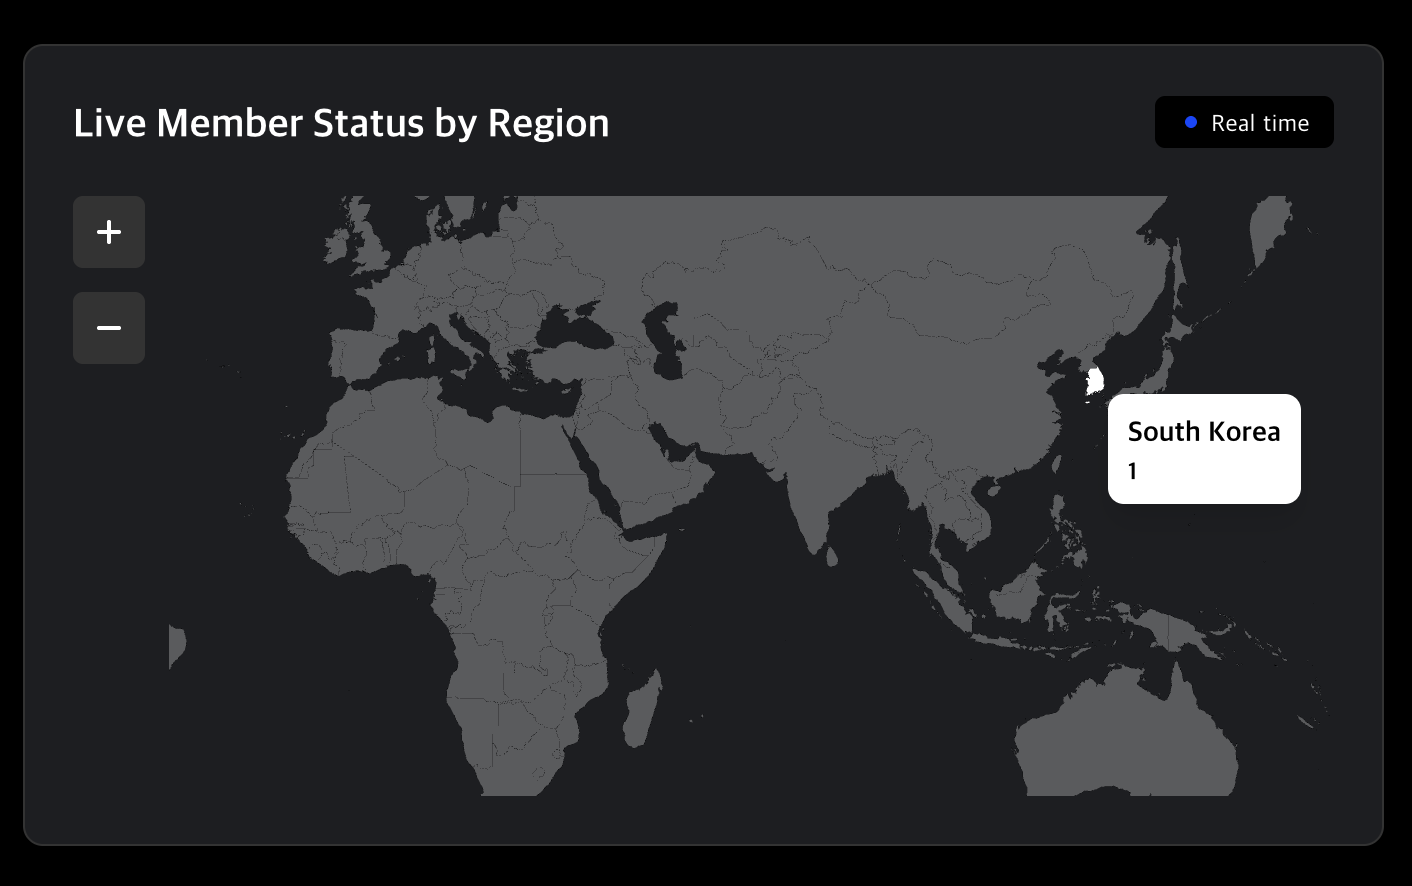
Q. The map isn’t responding!
A. Due to the high-resolution map, it may respond slowly. Please operate it gently, and it should function properly.
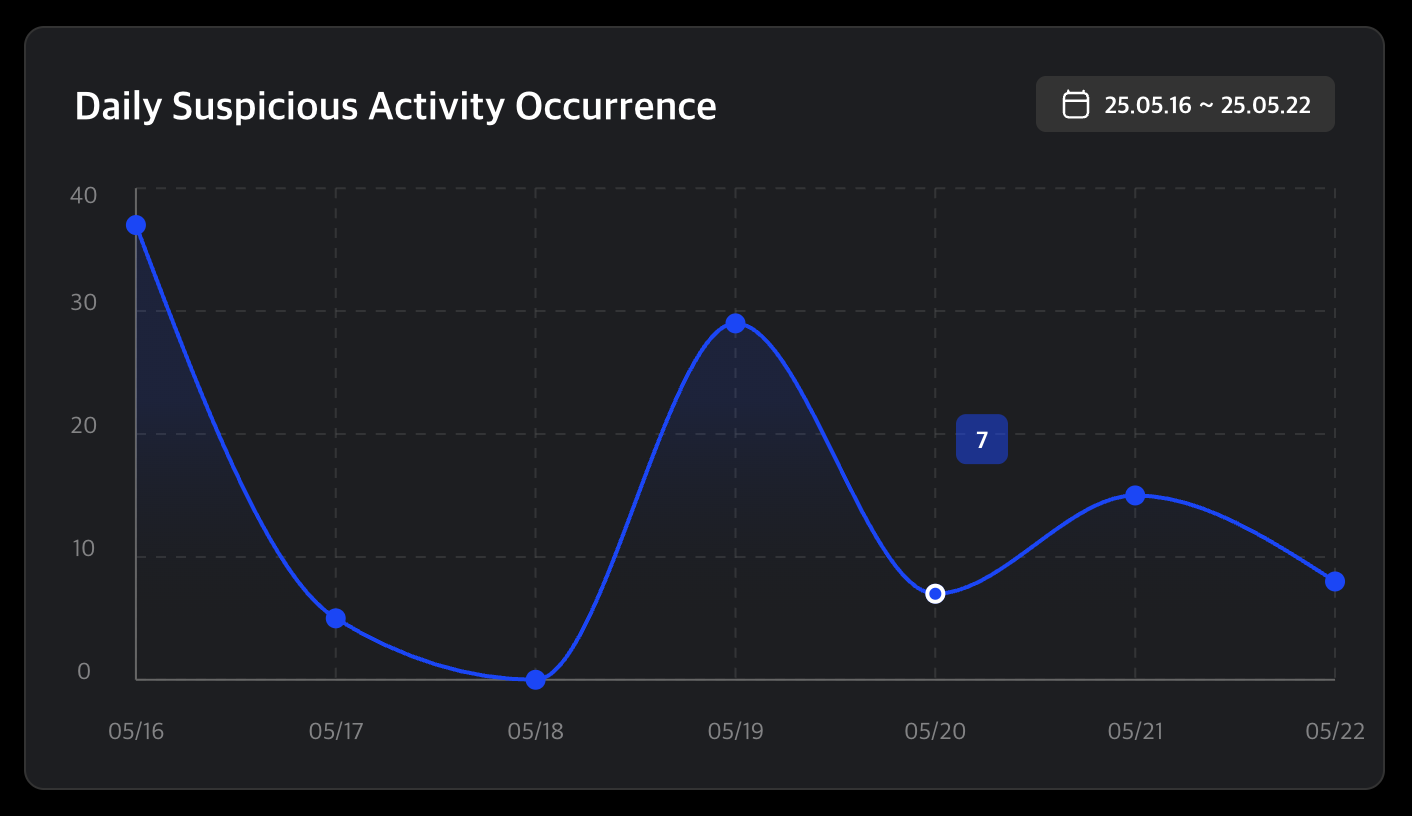
Daily Suspicious Activity Occurrence
You can select a date range to view a graph showing the number of suspicious activities over time.
The x-axis represents dates, and the y-axis shows the number of cases.
Hover over a dot or date range to see detailed numbers.
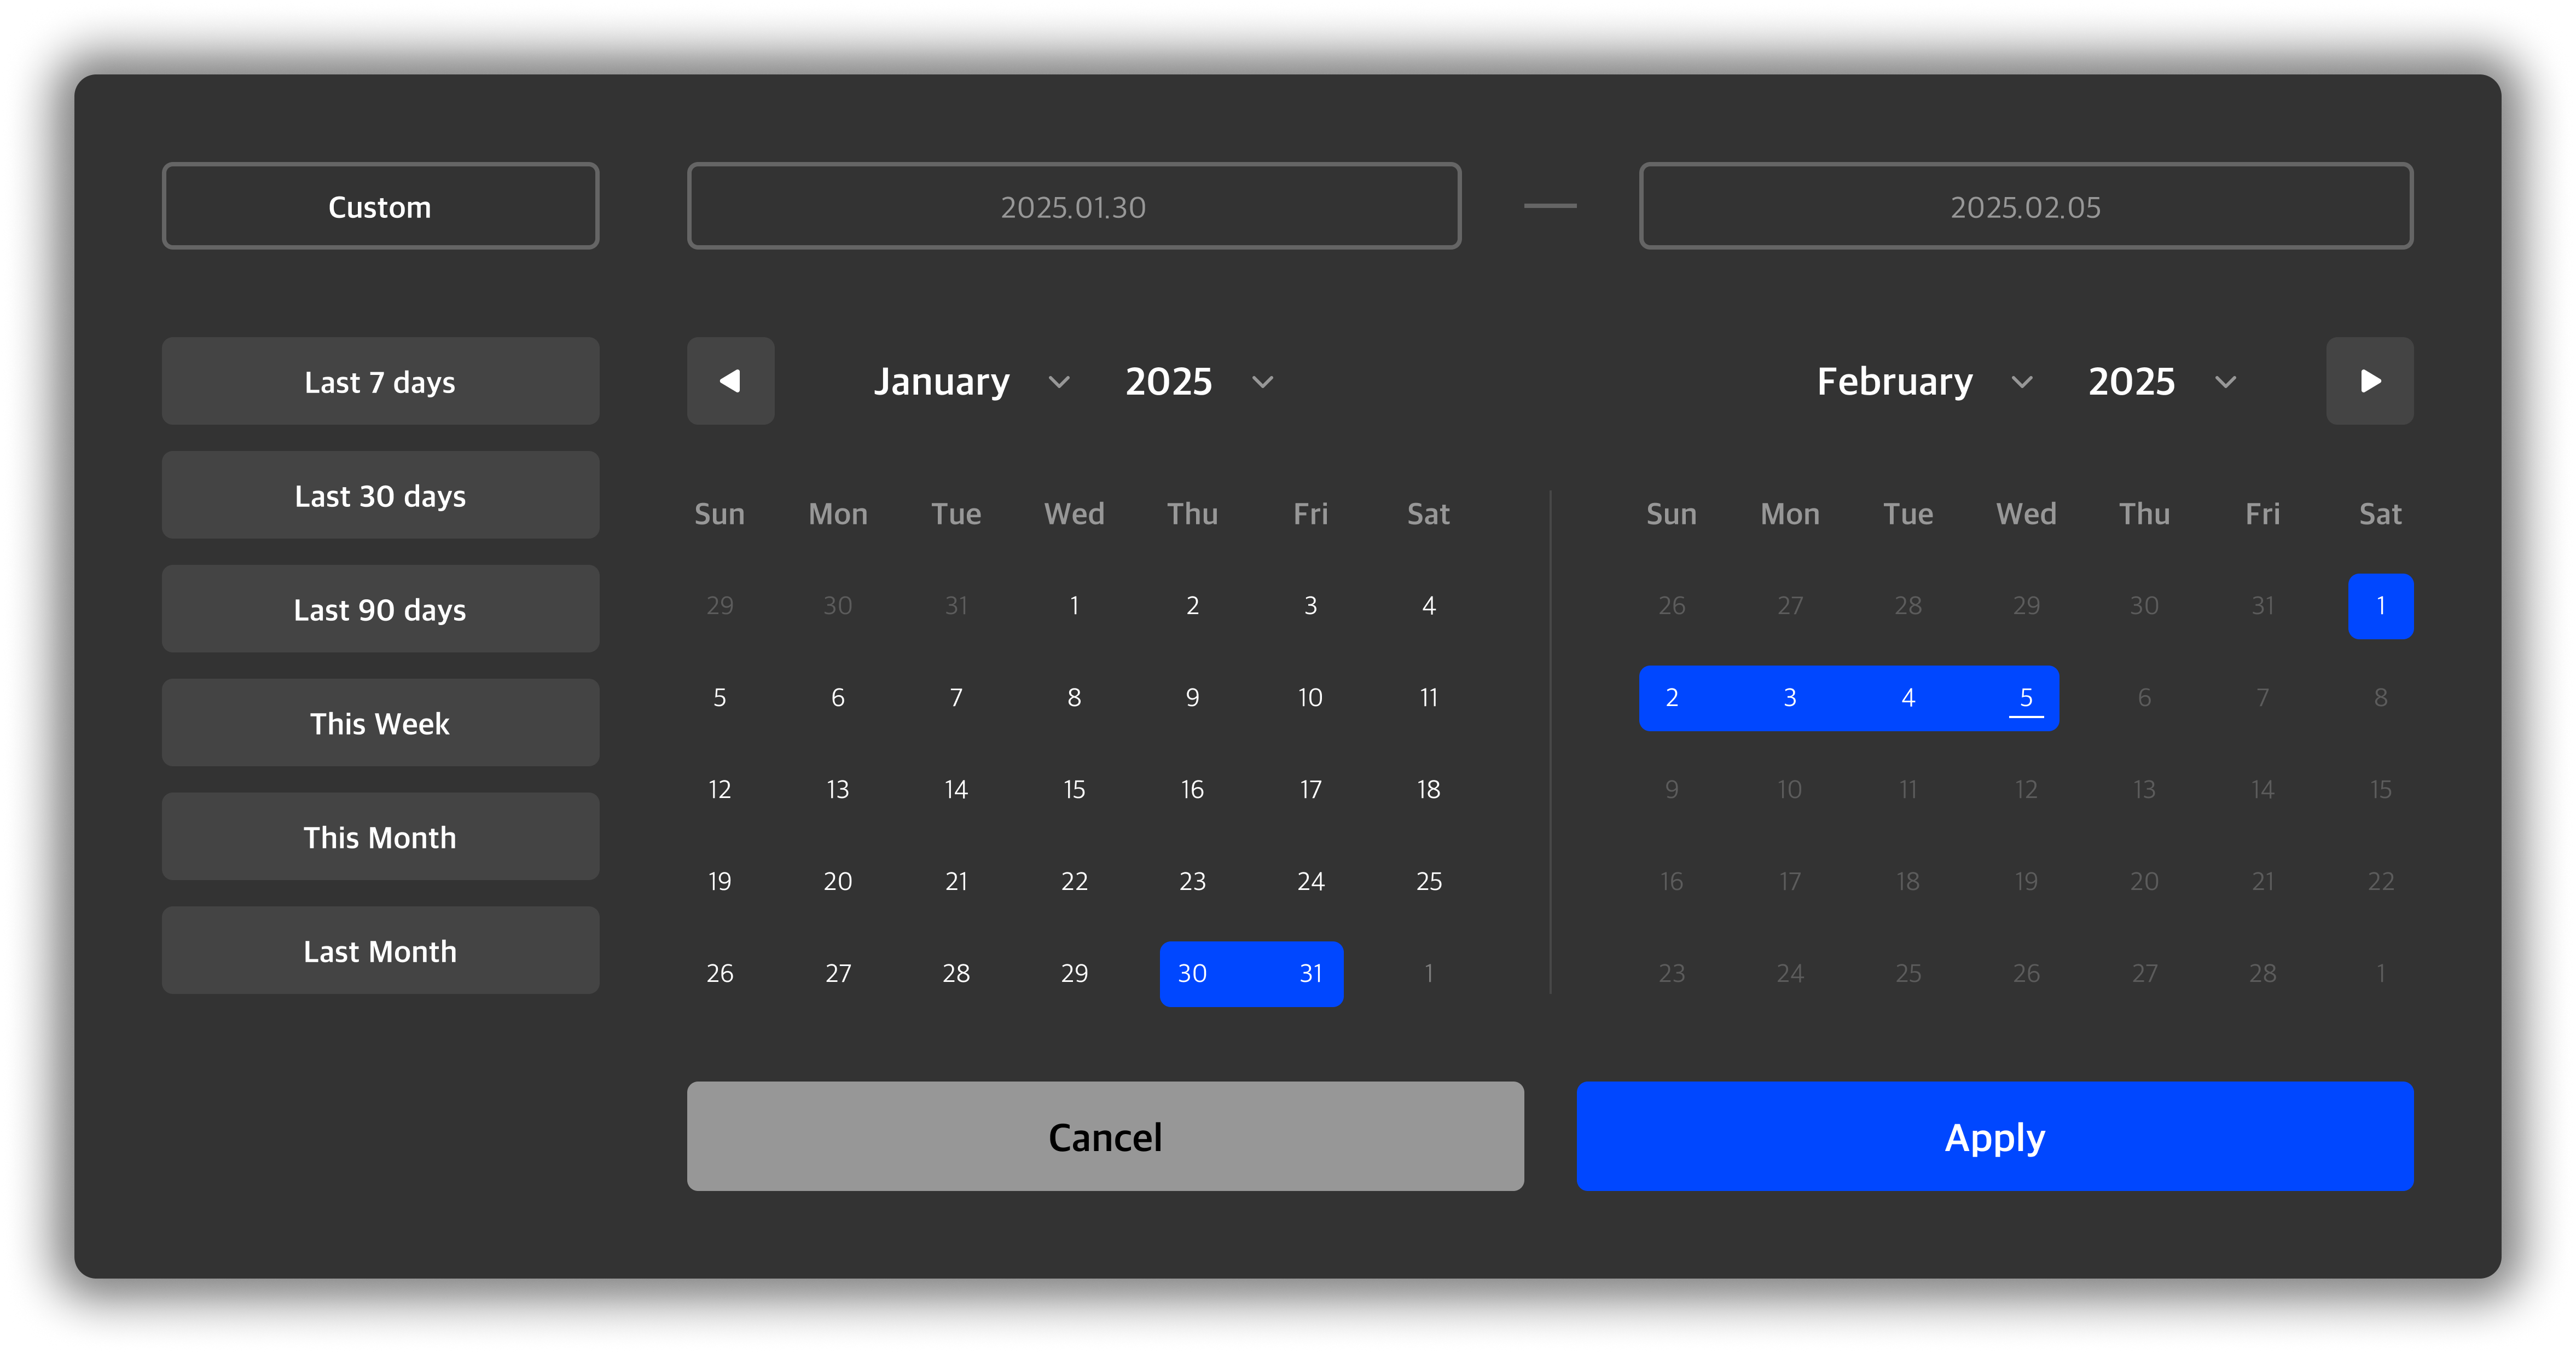
✅ How to Select a Date Range
- Click the date input field to open the calendar
- Select specific dates or drag your mouse to choose a range
- The chart will automatically update based on the selected period
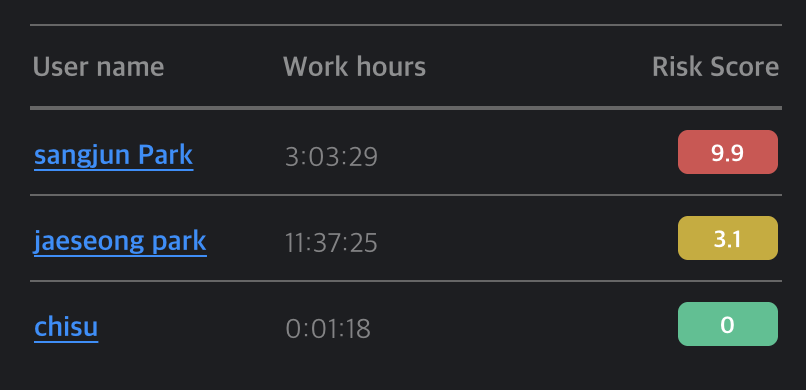
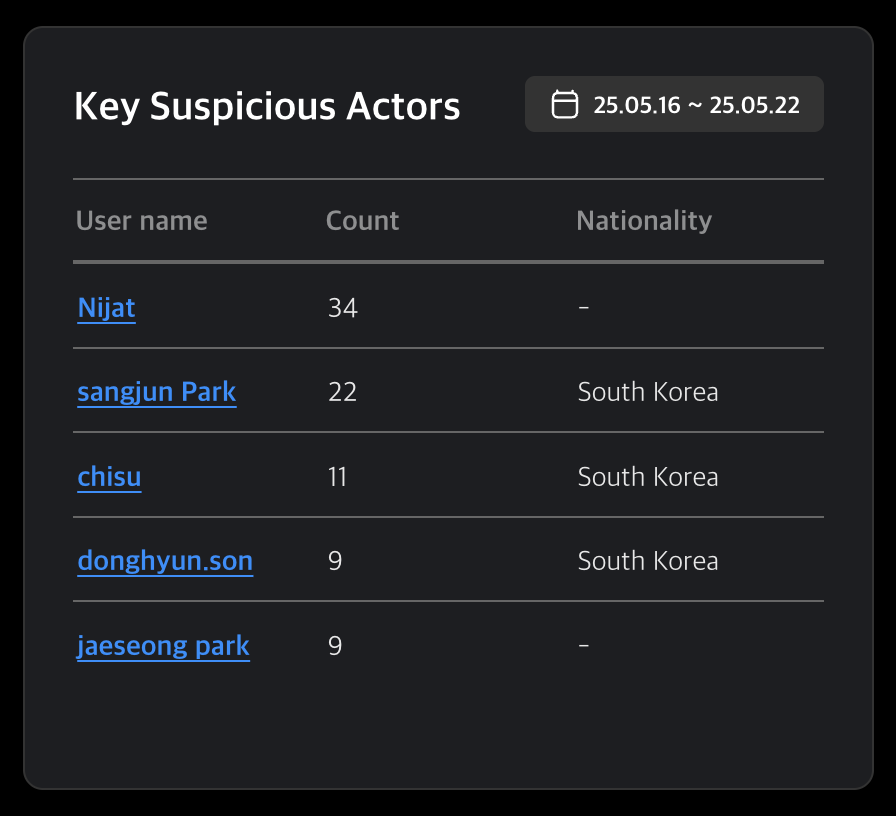
Key Suspicious Actors
Displays the users who generated the most suspicious activities during the selected period.
Clicking a user name takes you to their detail page.
Q. Why don’t country flags appear here like they do on the Live Map?
A. Country data in this section is not based on connection location.
It only appears if the administrator has manually entered the country for that user.
Users cannot edit or add this information themselves.
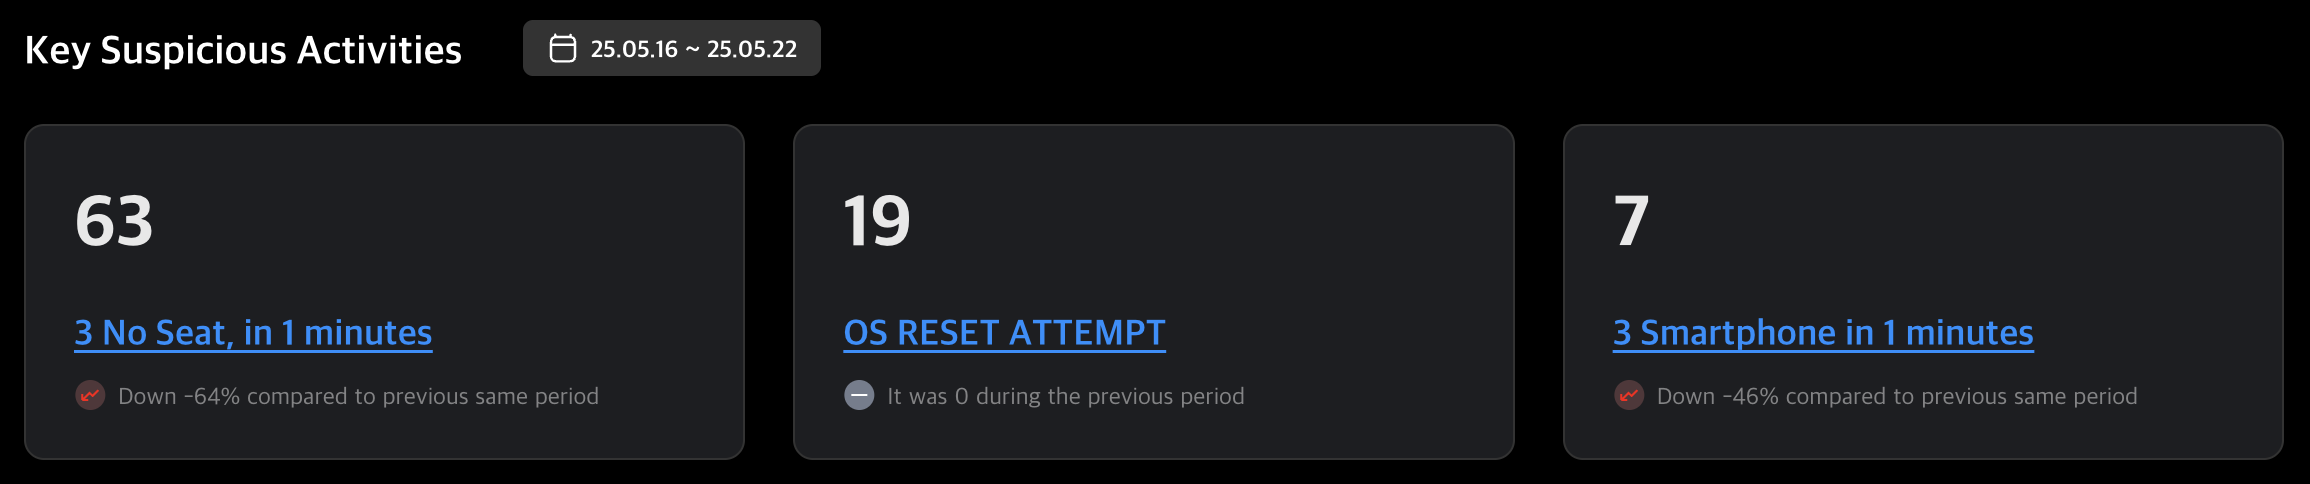
Key Suspicious Activities
Shows suspicious activity types during the selected period and their frequency.
Activities are visualized as percentages so you can compare scenario occurrences.
Q. Can I compare this with previous time periods?
A. Yes. Once you select a date range, the system compares it with the previous period of the same length. See the examples below:
Comparison Examples
- If you select 7 days → Compared with the 7 days prior
- If you select 1 day → Compared with the day before
Click on a suspicious activity type to filter and go directly to the filtered list view for that scenario.